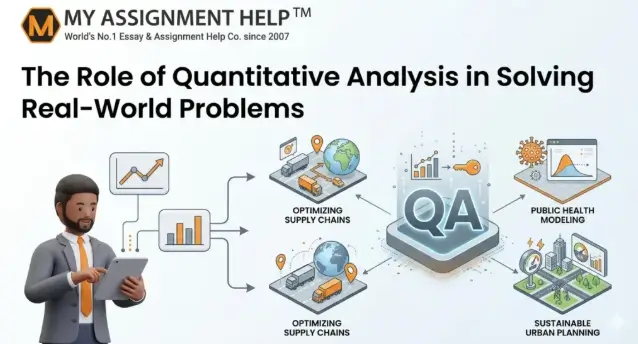
In an era dominated by big data, organizations no longer rely on intuition alone to make critical decisions. From predicting market fluctuations and optimizing supply chains to tracking global disease outbreaks, the modern world runs on data. However, raw data in its native form is merely noise. The true value lies in the ability to interpret it, a process driven entirely by quantitative analysis.
Quantitative analysis uses mathematical and statistical modeling to understand behavior, predict outcomes, and solve complex, real-world problems. By converting abstract phenomena into measurable metrics, it provides an objective framework for decision-making across governance, healthcare, finance, and logistics.
Understanding Quantitative Analysis: The Data-Driven Blueprint
At its core, quantitative analysis eliminates subjectivity. While qualitative assessments provide context through observations and interviews, quantitative methods deliver empirical evidence through numbers, ratios, and statistical significance.
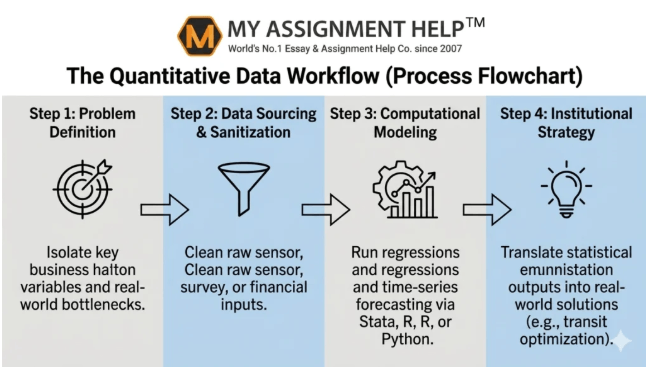
The analytical workflow relies on a systematic, four-part process to turn raw information into strategic action:
- Problem Definition: Identifying the specific variables and real-world challenges to be solved.
- Data Collection & Cleaning: Gathering high-quality data from surveys, sensors, or financial ledgers, and removing anomalies or missing values.
- Statistical Modeling: Applying regression analysis, time-series forecasting, or hypothesis testing to uncover hidden patterns.
- Interpretation & Implementation: Transforming statistical outputs into actionable organizational strategies.
To see this workflow in action, consider how municipal planners optimize public transit. By tracking commuter numbers, peak travel times, and traffic delays, analysts build predictive models that adjust bus schedules in real time, saving cities millions of dollars in fuel costs and reducing commuter wait times.
See also: What Is Decentralized Identity?
Driving High-Stakes Decisions Across Key Industries
The practical applications of quantitative analysis are vast, touching almost every major industry today.
1. Healthcare and Epidemiology
During public health crises, quantitative models are vital for survival. Epidemiologists utilize stochastic modeling and differential equations to project virus transmission rates and evaluate the potential impact of interventions like vaccination campaigns. According to data tracked by the Centers for Disease Control and Prevention (CDC), predictive mathematical modeling directly shapes resource allocation, determining how critical medical supplies and staff are distributed to hospitals nationwide.
2. Financial Markets and Risk Management
In Wall Street institutions, quantitative analysts—or “quants”—develop algorithmic trading systems based on historical mathematical patterns. By utilizing regression analysis and pricing models, firms assess asset valuation and manage portfolio risk. Quantitative metrics like Value at Risk (VaR) allow investment banks to determine the maximum potential loss over a specific time frame, protecting the global financial system from systemic collapses.
3. Supply Chain and Logistics Optimization
Global supply chains are incredibly delicate ecosystems. E-commerce giants leverage linear programming and network optimization models to determine the most efficient delivery routes, warehouse locations, and inventory levels. For instance, predictive analytics help companies forecast consumer demand spikes during peak holiday seasons, ensuring warehouses are stocked without creating costly surpluses.
Overcoming Obstacles: Tools of the Analytical Trade
Executing complex quantitative research requires robust analytical infrastructure. Software packages like R, Python, SAS, and Stata have become industry standards for handling massive, multi-variable datasets. These platforms allow analysts to run intricate regressions, visualize data patterns, and ensure the statistical validity of their findings.
Navigating these sophisticated statistical frameworks can be challenging for emerging analysts and students. Academic support platforms like myassignmenthelp provide specialized guidance, offering comprehensive analytical training to master data manipulation, regression models, and econometric analysis. Developing proficiency in these computational tools is essential for translating raw data into meaningful, real-world solutions.
When researchers or university students require more structured guidance to map out complex datasets, leveraging dedicated stata homework help portals can significantly accelerate the learning curve. Acquiring these core engineering and statistical skills ensures that professionals can reliably transform raw data sets into actionable institutional decisions. When individuals need comprehensive academic support across various analytical disciplines, finding an expert to help me with assignment obligations ensures they grasp these complex mathematical methodologies effectively.
The E-E-A-T Framework in Quantitative Research
When publishing or utilizing quantitative data, adhering to Google’s E-E-A-T (Experience, Expertise, Authoritativeness, and Trustworthiness) guidelines is paramount. Data can easily be manipulated or misread if proper methodologies are ignored.
The Core Pillars of E-E-A-T in Quantitative Data
- Expertise: Verified credentials of the data analysts performing the research.
- Experience: Hands-on application of statistical software and real-world data handling.
- Authoritativeness: Citations from peer-reviewed journals, institutional whitepapers, and official data centers.
- Trustworthiness: Transparent methodologies, open-source data availability, and clearly defined margins of error.
To maintain long-term credibility, researchers must guarantee data provenance by sourcing datasets exclusively from reputable, verifiable entities such as the U.S. Census Bureau, the World Bank, or peer-reviewed academic databases. Furthermore, a complete mitigation of bias is necessary, meaning analysts must explicitly acknowledge data limitations, such as selection bias or confounding variables, to maintain true scientific objectivity.
Key Takeaways
- Objective Precision: Quantitative analysis removes personal bias, offering empirical, numbers-driven solutions to multi-layered problems.
- Universal Application: From tracking global healthcare trends to maximizing supply chain efficiency, mathematical modeling drives modern operational planning.
- Advanced Infrastructure: Mastery of specialized software tools is necessary to manage big data and generate reliable statistical outputs.
- Credibility Matters: Following strict E-E-A-T principles ensures that data-driven insights remain accurate, reliable, and transparent.
Frequently Asked Questions (FAQs)
What is the main difference between quantitative and qualitative analysis?
Quantitative analysis focuses on numeric data and statistical models to find objective patterns and verify hypotheses. Qualitative analysis focuses on non-numeric data, such as interviews, open-ended text observations, and focus groups, to understand underlying meanings, opinions, and motivations.
Why is regression analysis so widely used in modern business?
Regression analysis allows organizations to understand the precise relationships between different variables. For example, a business can use it to determine exactly how changes in advertising spend (the independent variable) impact total product sales (the dependent variable), allowing for precise budget optimization.
How do data analysts ensure their models are accurate?
Analysts validate models by using techniques like cross-validation, checking p-values for statistical significance, evaluating R-squared values for model fit, and testing models against historical, real-world data to see how accurately they predict known outcomes.
Author Profile
Dr. Robert Vance, Senior Content Strategist & Data Analytics Expert Dr. Robert Vance holds a Ph.D. in Applied Statistics with over twelve years of experience teaching econometrics and conducting predictive data modeling. Currently serving as a Senior Content Strategist and Academic Consultant at myassignmenthelp, Dr. Vance specializes in breaking down complex computational concepts into actionable insights. His research on predictive analytics has been featured in numerous digital publications and academic journals.
References and Verifiable Sources
- Centers for Disease Control and Prevention (CDC): Infectious Disease Modeling and Resource Allocation Metrics.
- Harvard Business Review: How Data-Driven Decisions Win in the Modern Market Ecosystem.
- The World Bank Data Bank: Global Development Indicators and Quantitative Frameworks.